Method of Steepest Ascent
|
Often we are in a position where we wish to find the maximum or minimum of some response in our system. We may, for example, wish to control factors of temperature and pressure to achieve the best possible reaction yield. The Method of Steepest Ascent is a means to design experiments to efficiently find such optimal conditions.
If we were to plot all possible responses of the system of interest to an f number of factors, we would end up with an f-dimensional surface. Say we had two factors, x1 and x2, our response, y, may create a surface something like that shown in Figure 1.
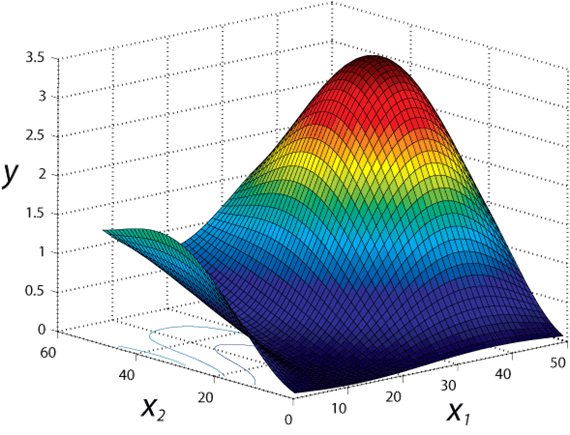
Figure 1: Example response surface plot with two factors.
With the Method of Steepest Ascent we hope to find the highest point on that surface.
To begin we select a starting point for our two factors. If we have experience with and intuition for the response surface, we may start with an educated guess; otherwise we may simply choose randomly. Around that point we conduct a set of experiments containing enough points by which we could fit a plane (f+1). Here we will add two additional points, in order to account for possible noise and curvature and conduct a 22 factorial design (the distance between factors, again, must be left to intuition or honed down iteratively).
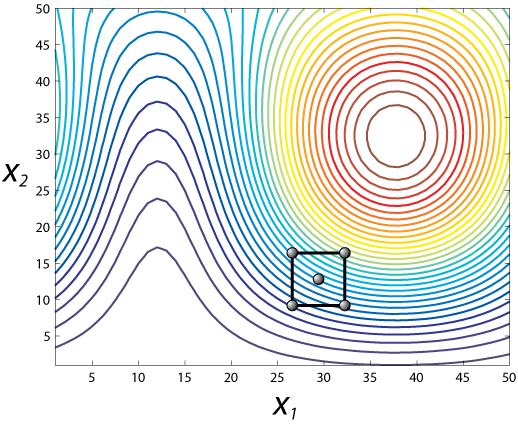
Figure 2: Contour plot of response surface from Figure 1,
with 5 experimental measurements.
Once we have taken our measurements, we then wish to fit a plane to that area of our response surface (Figure 3).
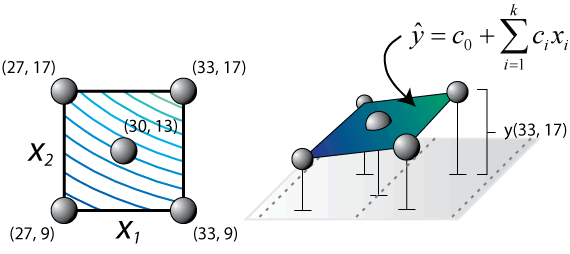
Figure 3: Fitting a plane to our experimental points.
We can express the equation for this plane by the following equations:
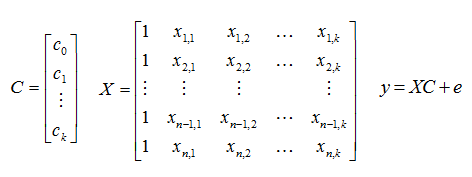
The constants in vector C which minimize the error, e, must be found, given the fact that the factor levels in matrix X result in the vector of responses, y. To do this, we perform a simple least squares fit:
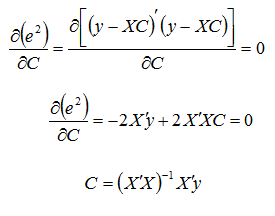
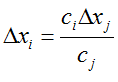
Using the above equation for C we obtain our fitted plane. To choose our next experiment we decide on an appropriate step size in a factor of our choice, factor j; such a choice may be left to intuition based on the change in response seen in the initial 22 factorial design. The change in the level for our factor j is Δxj and it should be have the same sign as the regression coefficient on this factor, cj (unless we wish to find the minima, in which case it should have the opposite sign). For all other factors we alter their levels using the following equation:
Now we have a new experimental point and can repeat this process until the response begins to decrease, at which point we must conduct a 22 factorial design of experiment around the last point and fit another plane to obtain a new heading towards the maxima (Figure 4).
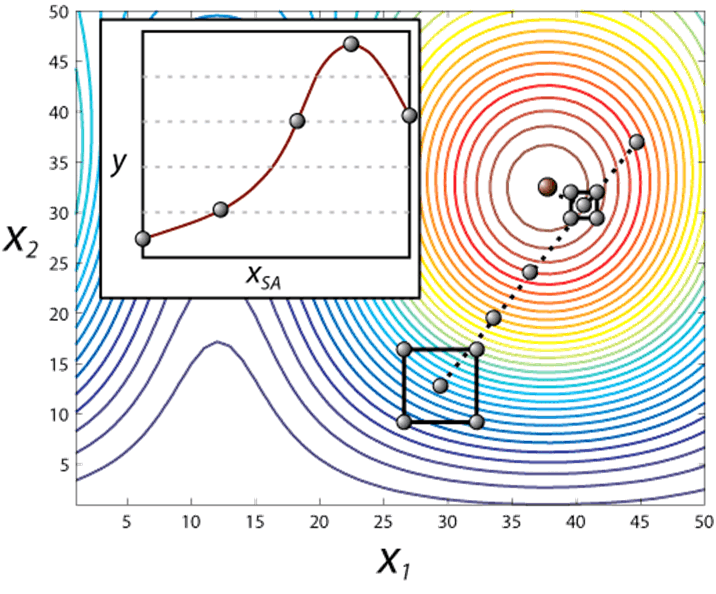
Figure 4: Iterative method for finding the maxima.
Note that, if we were unlucky and randomly chose a point at, say, x1=5 and x2 =5, we would approach a maxima that wasn't the largest maxima given the available levels of the two factors. Therefor, in some instances when we have no feel for the response surface, care must be taken to sample a broad range of factors initially, before using the method of steepest ascent.
The following applet may be used to practice this method. The code creates a random response surface, z. By clicking on this black surface you may take measurements and attempt to find the maxima. Once you feel you have found it, click "Show Surface" to reveal the actual response.
|
||||||||||||||||||
|
||||||||||||||||||
|
||||||||||||||||||