Artificial Inversion
Summary
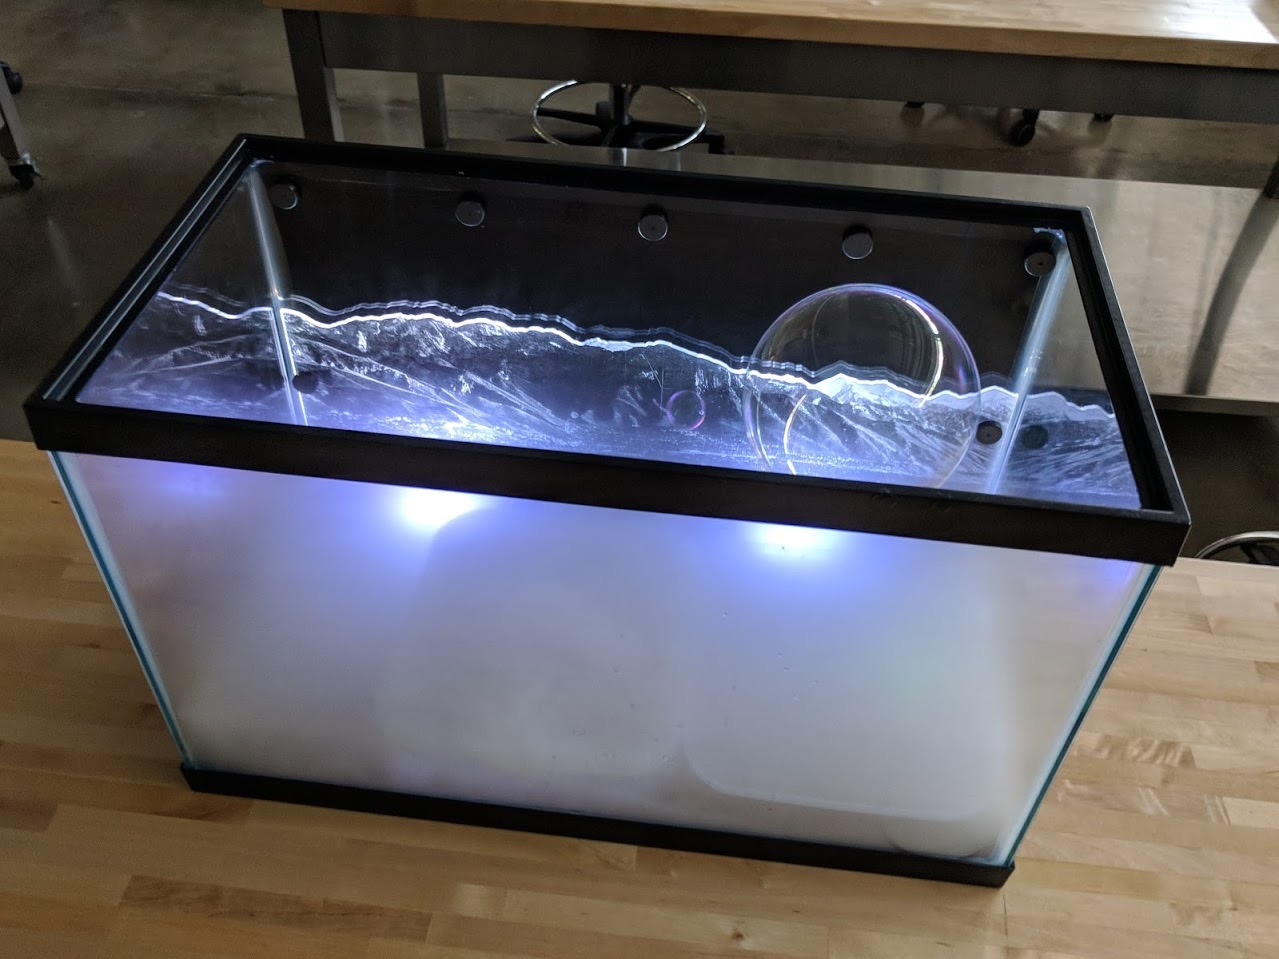
Poor air quality is an important health and economic problem that affects many communities, including the Salt Lake Valley. In fact, Salt Lake City occasionally has the worst air quality in the nation. Winter inversions are one major cause for poor air quality in the Salt Lake Valley and in other valleys like Beijing and Mexico City. In this teaching module, students will learn how an inversion works using a fish tank, dry ice, and bubbles.
General Information
Essential Questions
- How can the geography of a city/valley affect that area’s air pollution?
- What is an inversion and how does it work?
- What is air pollution made of?
Materials & Methods
- Fish tank/ aquarium (a 10 gallon tank works well, about 20” x 12” x “10”)
- Dry ice
- Water
- Bowl or container for water and dry ice
- Bubbles and/or match/candle smoke
- Gloves for safe handling of dry ice
- Optional thermometer or thermal camera
Background for Teachers
Air Quality Background:
The World Health Organization estimates that in 2012 approximately 3.7 million people died as a result of ambient air pollution. Outdoor pollution levels in a region depend on the number and intensity of pollution sources as well as the atmospheric conditions. Among commonly monitored air pollutants, fine particulate matter (PM2.5), particles with diameters smaller than 2.5 microns, has the greatest adverse health effects. Elevated PM2.5 levels are a particularly important issue in northern Utah and in other populated mountain valleys where pollution is trapped by a combination of the mountains and the weather. In locations like Salt Lake City, Mexico City, and Beijing PM2.5 levels can exceed national and international health standards for periods ranging from a few days to weeks, particularly in the winter. These episodes of poor air quality create significant health and quality-of-life consequences for a region’s citizens, including increased incidence of heart attacks, stroke and mortality.
Government agencies, such as the Utah Division of Air Quality (DAQ), and citizens rely on air-quality data from sparsely distributed monitoring stations for planning purposes and for communicating air quality. These stations are equipped with high-quality, costly instruments that meet federal monitoring requirements. However, sparsely distributed stations may not accurately represent the pollutant gradients within a city. In Salt Lake City differences in elevation, land use and other factors result in daily average PM2.5 concentrations at the neighborhood-level that may not be well represented by the nearest state monitoring station. In addition to sparse spatial distribution, the government monitoring stations have limited temporal resolution. For example, only two stations in Salt Lake County provide hourly PM2.5 levels. This gap in temporal resolution is particularly important in light of studies suggesting that even short-term increases in pollutant levels increase the incidence and severity of asthma and cardiac events.
Networks of low-cost, air-quality sensors can help bridge these spatial and temporal gaps and provide key information to air-quality managers, health-care providers, and the community at large to better understand air quality and minimize exposure risks. However, many of these low-cost sensors lack independently gathered calibration data, quality assurance procedures, or descriptions of when the sensors may provide inaccurate readings. Presenting unreliable or uncertain information from sensor networks can cause either unnecessary public concern or complacency about pollution levels and the associated health risks.
Two of the project goals are to leave each classroom with a low-cost, air-quality sensor and to have your class help determine:
- How well outdoor air-quality measurements represent local air quality in and outside your school.
- How well the sensors perform over time.
The Physics:
The air in the room and in the aquarium may be estimated to behave according to the ideal gas law.
|
|
|
(1) |
where P is the air pressure, V is the volume of air, n is the number of moles of air, T is the temperature and R is the gas constant (8.314 J/mol/K). Rearranging this equation we can get the following:
|
|
|
(2) |
where v is the gas’ molar volume, the volume one mole of the gas occupies at that temperature and pressure. The gas density, ⍴, is its average molecular weight divided by the molar volume,
|
|
|
(3) |
and so the larger the molar volume, the lower the gas density.
The pressure change from inside the aquarium verses to just above the aquarium is negligible. Both pressures can be assumed to be atmospheric. You could have the students do this calculation. For example, the density of air at 1 atm and 15 ℃ is about 1.225 kg/m3, as calculated by the ideal gas law. So the 1 ft (0.3 m) of height to the top of the aquarium only accounts for a change in pressure of:
|
|
|
(4) |
That is 3.6 Pascals which is merely 3.6e-5 atm. The percent change in pressure is basically nothing, only 0.0036%, and it cannot of course account for the difference in air density if these two pressures were put into Equation 1.
Instead, temperature is the primary factor affecting molar volume. Dry ice, solid CO2, at 1 atm pressure, should be a very cold -79.5 ℃ (-109.3 ℉). Assuming a normal indoor room temperature of 25 ℃, this represents a difference of over 100 ℃ from the surface of the sublimating dry ice to the room above.
The actual temperature of the air at the base of the aquarium results from a mixture of the -79.5 ℃ CO2 gas coming off the dry ice, the near 0 ℃ water in which the CO2 is sublimating, and the room temperature seeping in through the aquarium glass. It’s complicated. The true temperature difference in the gas is more likely on the order of 25 ℃ (which would also be a difference of 25 K). This would mean a difference in temperature of about ![]() , which is not negligible. Because, in Equation 1, v is proportional to T, and P doesn’t change much, that means the same percentage change for v of 8% applies from inside to above the aquarium.
, which is not negligible. Because, in Equation 1, v is proportional to T, and P doesn’t change much, that means the same percentage change for v of 8% applies from inside to above the aquarium.
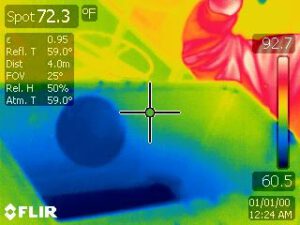
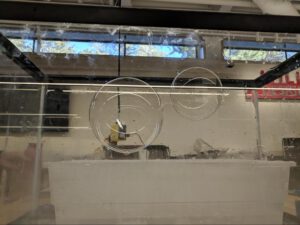
The thermal image below shows the inside of the aquarium with a bubble floating on the inversion layer. The temperature of the gas is not detectable in the thermal image but the cold dark-blue temperature at the bottom of the aquarium can be seen. The transition from cold to warm can also be seen on the glass near the person’s warm arm (the red object). The bubble appears somewhat cold, due to the evaporation of water off of its surface (this would may not be the case under very humid conditions). However the bubble is filled with warm air, from the lungs of a person (Which comes out at a balmy 37 ℃, about 10 ℃ above room temperature).
Not only does the aquarium contain denser cold air, it contains a good deal of CO2 gas. The average molecular weight of air is 29 g/mol, but CO2 is 44 g/mol. Thus the average molecular weight of the gas in the aquarium is higher than it is outside, further adding to its density (Equation 3). This contribution to the density difference is not as important as a pure temperature effect during an inversion event, but it is significant in this demonstration.
Due to all these factors, it would be quite difficult to accurately calculate the actual density of the aquarium gas. It would also be difficult to determine a bubble’s density. The bubble contains air that is a bit warmer than room temperature, but it’s also surrounded by a very thin layer of dense liquid, which is undergoing evaporation and thereby cooling its surface.
However, we do know the total bubble density must be less than the density of the air in the aquarium. When something floats on a fluid its total density must be less than that fluid according to Archimedes’ Law. When the bubble is stationary, there is no acceleration, and that means the forces must be balanced.
|
|
|
(5) |
|
|
|
(5) |
The gravitational force (the mass of the bubble times the gravitational constant, g) has to be equal to the buoyant force (the volume of the bubble times the density of the air in the aquarium).
Instructional Procedures
![]()
![]()
![]()
![]()
![]()
![]()
![]()


- Place fish tank on flat surface
- Fill bowl/container with water
- Place bowl/container in aquarium
- Wearing insulating gloves to protect your hands, place dry ice in bowl/container filled with water
- The warm air from the room should trap the cold dense air from the dry ice in the tank
- Blow bubbles into the aquarium and they should float on top of an inversion layer.
- You may drop a match into the aquarium and it will be snuffed out by the CO2. The smoke from the match will remain trapped in the inversion.
- A thermometer or thermal camera may be used to measure the temperature gradient in the aquarium.
Source Code
Acknowledgements
These teaching modules are supported by the National Science Foundation and the Rocky Mountain Power Foundation.