Arduino Air Quality Sensor
Summary
Poor air quality is a problem that affects the health of many communities, and measuring air quality can be extraordinarily important to people with health problems. In this module you will build a simple air quality sensor with inexpensive and readily available parts.
General Information
Essential Questions
- How can we measure air quality?
- What is scattered light?
- What are sources of particulate matter that we encounter in our everyday life?
Materials & Methods
- Arduino Uno board or equivalent. For example: https://www.sparkfun.com/products/12757 . Note that we have used the most inexpensive models on Amazon, and SparkFun RedBoards, and all have worked as well for this as a traditional Arduino Uno.
- The board can be powered through a USB cord to a phone charger, phone external battery, or computer, or through a 9V battery connection using something like the following: https://www.amazon.com/IDS-Battery-Power-Cable-Arduino/dp/B072PTY1WM/ref=sr_1_7?ie=UTF8&qid=1525987560&sr=8-7&keywords=arduino+9v+battery+adapter&dpID=41m3xLRH-0L&preST=_SY300_QL70_&dpSrc=srch
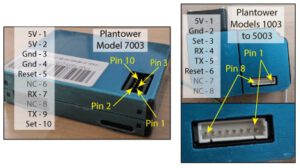
- Air quality sensor. We are using the air quality sensors from Plantower (http://www.plantower.com/en/). Our code should work with any of the following models: 1003, 3003, 5003, and 7003. However, note in the arduino code that, depending on the model, you will need to change the variable LENG. The code is commented heavily and it should be clear which line is needed for which model. These sensors can be most readily purchased on ebay.

- Breadboard & Male to Female Jumpers: A breadboard will make connecting all the wires needed for 5V and ground simpler, particularly if you use all the optional components in this module. Alternatively you could solder your own multi-pronged wires for 5V and ground. You can find many sorts of breadboards and jumpers on Amazon: https://www.amazon.com/s/ref=nb_sb_noss_1?url=search-alias%3Daps&field-keywords=breadboard
https://www.amazon.com/Foxnovo-Breadboard-Jumper-Wires-Female/dp/B00PBZMN7C/ref=sr_1_1?s=electronics&ie=UTF8&qid=1525989304&sr=1-1&keywords=female+to+male+jumpers&dpID=51is6kX6ZsL&preST=_SY300_QL70_&dpSrc=srch - Particulate Concentration Visualization: There are several options available for obtaining particulate count data, depending upon how involved you want to get. Keep in mind these low-cost air quality sensors provide a relative estimate of PM concentration. Your sensor would need to be calibrated for the types of particles you are seeing to provide accurate estimate.
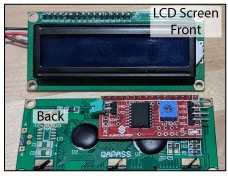

- LCD I2C Screen: We’re using a 16 column by 2 row LCD screen with the I2C Arduino package. The code will display the time since the Arduino powered up, PM1.0, PM2.5, and PM10 concentrations. There are many LCD screens on the market you can use; we are using one from Amazon (just make sure it’s not only the screen and includes the board that requires only 4 wires as shown in the figure below.). https://www.amazon.com/FICBOX-Serial-Backlight-Display-Arduino/dp/B071XP6PPT/ref=sr_1_5?ie=UTF8&qid=1525383666&sr=8-5&keywords=lcd+screen+arduino
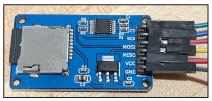

- MicroSD Card Reader: This allows you to record data for long periods of time to be opened later for analysis on a computer. You’ll also need a micro SD card. The card should be something smaller than 32 GB and you’ll need to make sure it’s formatted FAT16 or 32 (Most will come this way but you’ll have to reformat some models yourself).
https://www.amazon.com/SenMod-Adapter-Reader-Module-Arduino/dp/B01JYNEX56/ref=sr_1_1_sspa?s=electronics&ie=UTF8&qid=1525987957&sr=1-1-spons&keywords=sd+card+reader+arduino&psc=1
https://www.amazon.com/gp/product/B00MHZ70KO/ref=oh_aui_detailpage_o00_s00?ie=UTF8&psc=1 - Computer: The serial monitor in the Arduino sketch editor can be used to see the particulate concentrations if connected through the USB (use ctrl-shift-m to open, or it’s under tools). Also, if you have Python installed, the Python script at the end of this module will create real-time plots of air quality.
Other Materials you May Want:
- Watch: You will want to mark the time of day at which each sensor starts. The arduino will record data with the first reading being at t = 0 and you’ll want to know what time of day that corresponds to.
- GPS: You may want to measure where you are exactly, if you hope to compare your readings to those taken a distance away. You can read your GPS from many different phone map or compass apps, or you can find it later by going to google maps and clicking on the locations from where data was taken.
- Weather Station: You may want temperature pressure and/or wind velocity in your area, but those data could also be gathered from weather sites (though with less resolution).
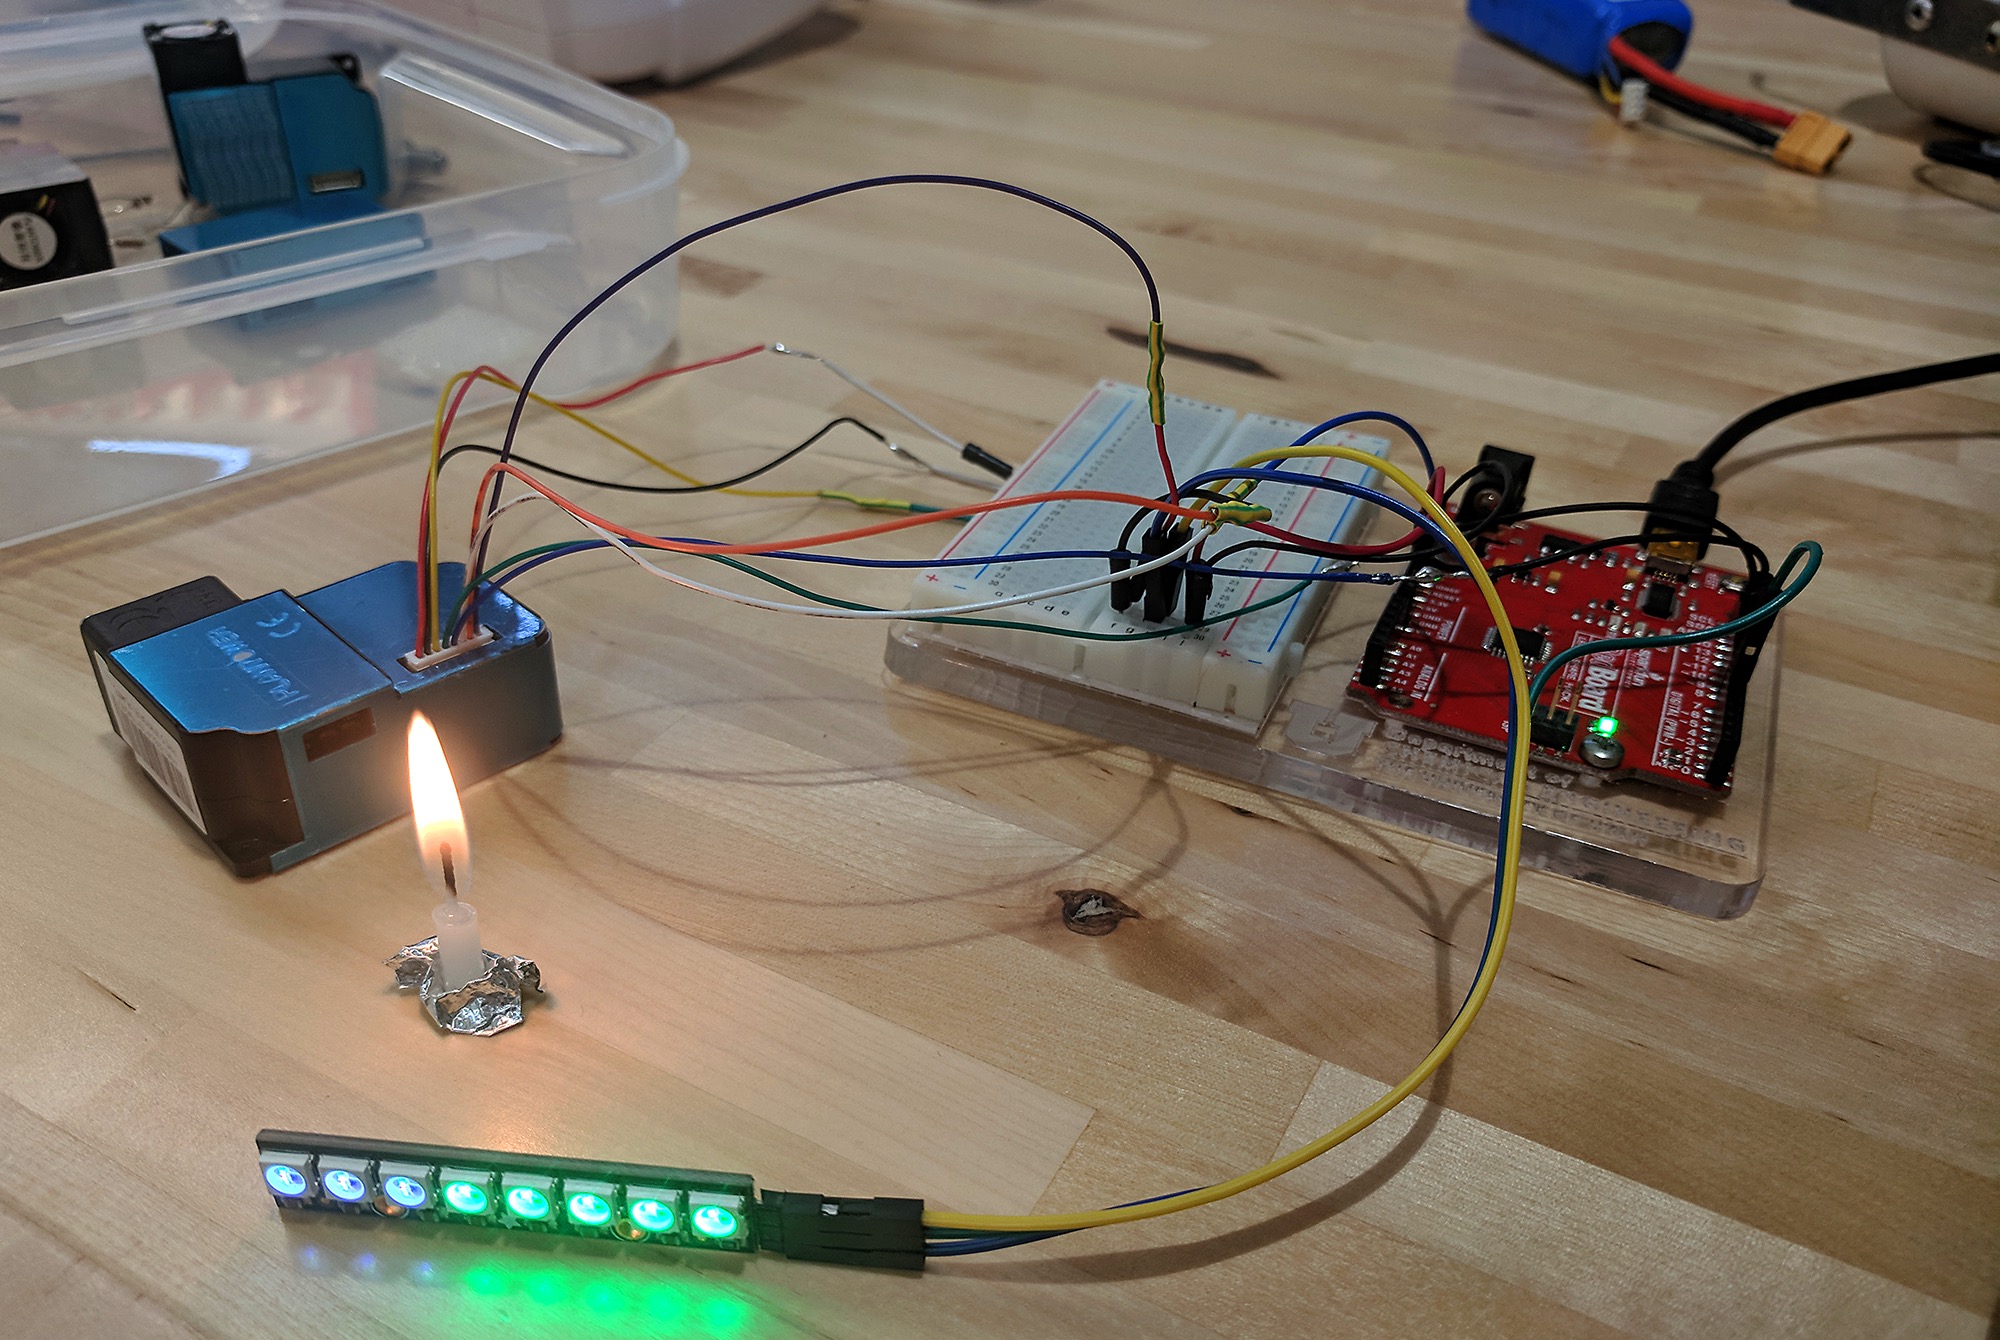
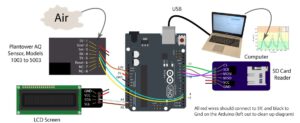
Wiring: The arduino, sensor, LCD screen, and SD card reader should be connected according to the following. You could leave off the screen or SD card reader if you want to read data through a computer. Note that the wiring shown is for all models but 7003; see the image of the 7003 sensor above to see how to alter the wiring for the AQ sensor.

Wiring Table:
|
Plantower |
Plantower |
Goes To |
SD Card |
Goes To |
LCD I2C Screen |
Goes To |
|
1 |
1 or 2 |
5 V |
CS |
10 |
GND |
GND |
|
2 |
3 or 4 |
GND |
SCK |
13 |
VCC |
5 V |
|
3 |
10 |
3.3 V |
MOSI |
11 |
SDA |
A4 |
|
4 |
8 |
4 |
MISO |
12 |
SCL |
A5 |
|
5 |
9 |
3 |
VCC |
5 V |
|
|
|
6, 7, & 8 |
Others |
Not Used |
GND |
GND |
||
Code:
Some basic understanding of Arduinos is needed and you may want to start with some online Arduino examples, if you’ve never used them (https://www.arduino.cc/en/Guide/HomePage). The board must contain the “LiquidCrystal I2C” packages, which you will have to install one time in your Arduino sketch editor.
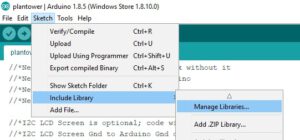
In general, to install arduino packages:
- Open the Arduino Sketch Editor.
- Click Sketch > Include Library > Manage Libraries
- Search for the library you want in the search bar that opens up
- Click on the package and then click install.
The following Arduino script, which reads from the sensor, must be uploaded to the board:
https://drive.google.com/file/d/1N7KHkNi3ASCUrKJLTVSF3G6TRo1y5-8h/view?usp=sharing
This code is also at the end of this teaching module, as an appendix. To see the PM values measured by this script without using the LCD screen, upload the script, open the Arduino Sketch Editor, and click tools>serial monitor (or ctrl-shift-m).
If you wish to plot and view the particulate counts in real-time on your computer, we have written a python script to do that. If you have not ever installed python, you may follow our screencast instructions here: https://www.youtube.com/watch?v=qNzeETi2dMM. This code is at the end of this teaching module, as an appendix, and it may also be found here:
https://drive.google.com/open?id=1rNuPbQuqFoqFIPlBgsN3ZPnjhnEX4_Jx
Background for Teachers
To present the background you may use the accompanying slide show:
https://docs.google.com/presentation/d/1BcF_PTui–5KUw_jwGCTYwLSYKQLMLqkZ4vViSR6Xnc/edit?usp=sharing
Air Quality Background:
The World Health Organization estimates that in 2012 approximately 3.7 million people died as a result of ambient air pollution. Among commonly monitored air pollutants, fine particulate matter (PM2.5), particles with diameters smaller than 2.5 microns, has the greatest adverse health effects. Elevated PM2.5 levels are a particularly important issue in northern Utah where PM2.5 levels can exceed national ambient air quality standards for periods ranging from a few days to weeks, particularly in the winter. These episodes of poor air quality create significant health and quality-of-life consequences for the region’s citizens, including increased incidence of asthma, juvenile arthritis, and mortality.
Government agencies, such as the Utah Division of Air Quality (DAQ), and citizens rely on air-quality data from sparsely distributed monitoring stations for planning purposes and for communicating air quality. These stations are equipped with high-quality, costly instruments that meet federal monitoring requirements. However, sparsely distributed stations may not accurately represent the pollutant gradients within a city. In Salt Lake City differences in elevation, land use and other factors result in daily average PM2.5 concentrations at the neighborhood-level that may not be well represented by the nearest state monitoring station. In addition to sparse spatial distribution, the government monitoring stations have limited temporal resolution. For example, only two stations in Salt Lake County provide hourly PM2.5 levels. This gap in temporal resolution is particularly important in light of studies suggesting that even short-term increases in pollutant levels increase the incidence and severity of asthma and cardiac events.
Networks of low-cost, air-quality sensors can help bridge these spatial and temporal gaps and provide key information to air-quality managers, health-care providers, and the community at large to better understand air quality and minimize exposure risks. However, many of these low-cost sensors lack independently gathered calibration data, quality assurance procedures, or descriptions of when the sensors may provide inaccurate readings. Presenting unreliable or uncertain information from sensor networks can cause either unnecessary public concern or complacency about pollution levels and the associated health risks.
Two of the project goals are to leave each classroom with a low-cost, air-quality sensor and to have your class help determine:
- How well outdoor air-quality measurements represent local air quality in and outside your school.
- How well the sensors perform over time.
Electronics Background:
Only very basic understanding of electronics is useful but not absolutely necessary. The primary concern is that the wires are connected properly.
Arduino Board: All the needed connections on the arduino board are highlighted in the figure in the Materials section of this module. This could be explained to be, basically, a mini computer. It takes in data from the AQ sensor, manipulates it to get particulate concentrations, and then puts that data out for the user in the form of LCD characters, and/or a file on the SD Card, or it can also send that data to a computer to be plotted in real-time.
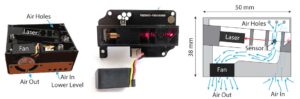
AQ Sensor: This device uses scattering of laser light (discussed below) to measure particulate counts. These work by measuring scattered light. The interior of one of these sensors is depicted in the following figure.
Some models have air coming in from a different area, but they all pull air through a dark chamber which has a light detector and a laser shining through it.

As laser light travels through clean air, which is free of particulate pollution, it travels roughly in a straight path. Almost none of the light could make, say, a 90° turn and hit the sensor. However, if particulate matter filled the air, light may be reflected off the particles in random directions. You can readily see such scattered light if, for example, you shine a laser through a cloud of smoke; the result will appear as a line of scattered light traveling through the cloud, whereas with clean air you may not ever detect a laser was passing through the space (Such a demonstration with a laser pointer and fog machine can be a good introductory addition to this module; you could also use a blue laser and tonic water compared to regular water; the quinine in the tonic will scatter the light).
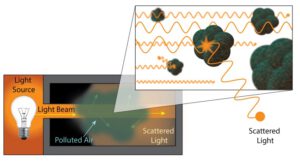
While this light is scattered randomly, some of the light will be scattered towards our sensor and detected. The more particulate matter in the air, the more likely it is that a photon of light will find its way to the sensor, and therefore we can quantify the amount of particulate pollution in the air.
LCD Screen: This device is only meant to show real-time data. It has 5V and ground wires to power the device and two other wires used to send data to be displayed.
MicroSD Card Reader/Writer: This device also has a host of wires which power the device and facilitate communication with the arduino. The Arduino will create a file on the SD card named PM_Data.csv. It’s called a CSV file (comma separated value), and it can be opened in a program like Excel or most any other program for data analysis. If the file already exists, the board will write new headers in the existing file and add the new data to the end of the old data (you may need to delete this file periodically to avoid filling up the card). Note that each time the sensor system restarts it will give a new random RunID and use that ID at the header of each new data set in the CSV file. The code does this because the arduino has no way of giving the actual time or date (it keeps resetting its clock at every restart). The user should match the RunID with a known start time and date.
Possible Research Questions Addressable by Students:
The research questions which student come up with themselves may be quite creative and much better, but here are a couple to get them started:
- Fireplaces: How much does wood vs gas matter? How far from a wood fire fireplace can the particulate effect be detected?
- Clothes dryers: Can particulates be detected in the laundry room when the dryer is on vs off? Can it be detected out by the dryer vent? If a dryer vent is clogged a lot of particulate matter can enter the house.
- Candles or incense: Assure all fire is handled in the safest manner by an adult. Are these a significant health risk? Which is worse and by how much? If my parent lights a candle in one room, what does that mean for particulate matter in other rooms?
- Aerosols (hairspray, cleaners): Do these generate significant particulates in the room where they are used? Are these particles different than, say, particles from a fire? Note: don’t spray directly around the sensor or it will coat the detector and it won’t work very well…
- Cleaning/dusting: Gather evidence that doing chores may be hazardous to your health…
- Cooking. Does what’s cooked matter? How it’s cooked?
- Soldering: What risks are there in soldering electronic components? How much does ventilation matter?
- Powders: Do kids playing in a sandbox generate a lot of particulates? Using flour? Mixing cement?
- Industrial sources: What particulate concentrations are there near a gravel pit or incinerator or power plant? How about a restaurant? Would type of restaurants matter (wood fired pizza place vs a sandwich shop)?
- Weather effects: How does wind affect readings from sources of particulates? Rain? Humidity?
- Elevation: If I take my sensor on a hike on a day with poor air quality, can I see evidence of the inversion layer and how quickly that transition happens? Send your sensor up on a tethered weather balloon…. You’ll need to use a phone app to also track elevation.
- Air quality events: What are the effects of fireworks used on local holidays? What about a forest fire a couple states away?
- Indoor vs outdoor: What is the relationship between indoor air quality with outdoor air quality? Does it matter what season it is? Does the age of the home matter?
- Motor vehicles: What is the effect of living near a busy street verses being in an isolated neighborhood? What is the effect of busses and parents dropping off and picking up kids at school and how far does it range?
- And many many others…
Instructional Procedures
- Group students into teams (teams of 3 works well).
- Give the background information on air quality and how the sensors are meant to work. This presentation may be useful:
- Pass out materials and one-page handout, which can be found at the end of this module, to aid students in their wiring..
- You may upload the arduino script to the boards beforehand, or show each team how to do that themselves at this point.
- Have the students wire the components. Make sure they do this while the board is not powered to avoid ruining components.
- Once students feel they are finished wiring, the instructor may want to quickly check them before they are powered.
- Plug in the sensor system.
- If the LCD is attached, it should state “Starting…” and then begin showing PM concentrations.
- If the system is connected through a computer, have the students open the arduino sketch editor and use ctrl>shift>m to view the serial monitor. In the monitor they should see some starting texts, followed by PM concentrations. Once you see the board is communicating properly, you could then move on to using the python script to visualize the data.
- If the components are not working as expected, see the troubleshooting section of this module.
- Test the sensor’s response by generating some particulate matter. This can be done with a small butane lighter (just by striking the flint without even creating a flame). Alternate sources could be a smoke machine, or spray mist (do not spray into the sensor; very little is needed to trigger a response).
- The particulate count on the LCD or in the serial monitor should respond.
- If the MicroSD card reader is attached:
- Record the RunID from the LCD or serial monitor at startup.
- Power down the system after the test.
- Remove the card and have students check it’s contents.
- Have them open the PM_Data.csv file in a spreadsheet program and see if the test is reflected in the data (Note that the heading of their data should have the RunID in its heading). At this point you could also instruct them on plotting data as well.
- Student are now ready to use their system to answer research questions. Use the remainder of the time to engage the class in discussion of possible research questions that they could now address.Example questions are given in this module.
- Once they have a research question, they should be instructed on how to appropriately collect data, use experimental controls, and perform data analysis. Some of these topics are addressed in the accompanying presentation. https://docs.google.com/presentation/d/1BcF_PTui–5KUw_jwGCTYwLSYKQLMLqkZ4vViSR6Xnc/edit?usp=sharing
- Set them loose for whatever time is needed to conduct their research (one week would be reasonable for most students).
- Regroup to discuss results.
Source Code
Arduino
Python
Acknowledgements
These teaching modules are supported by the National Science Foundation and the Rocky Mountain Power Foundation.