Spectrophotometer
Summary
Spectrophotometers are commonly used in laboratories and in industry in order to determine the amount of light absorbed by a solution. A spectrophotometer consists of a light emission source, a sample stage or flow cell, and a photodiode which reads the amount of light coming through the sample. The absorption of light of specific wavelengths can be related to a sample's composition using a calibration. This technique is commonly used for kinetic studies, tracking cellular growth, and chemical analysis. In this model we describe how to build and test a spectrophotometer for just over $10 (one that works as well or better than options costing orders of magnitude more). IMPORTANT!!! Under no circumstances should an unsupervised minor perform the procedures described herein. All the following described experiments and methods should be supervised by an adult who is completely familiar with and takes full responsibility for all possible hazards.
General Information
Essential Questions
- What is a spectrophotometer?
- How can we use absorption or transmission of light to gather data?
- What is the relationship between using analytical equipment and collecting data?
Bibliography
- Butterfield, A.E., Young, C., “An Effective and Economical Photometer for Classroom Demonstrations and Laboratory Use.” Chemical Engineering Education. Article, In press, 12/22/2011.
Materials & Methods
- A Light Source – Any LED will work. We have used single standard LEDs and switched out colors as needed, but we prefer to use multicolor LEDs so that we can quickly switch between wavelengths (e.g. BIVAR, R50RGB-4-0045).
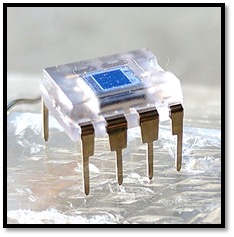
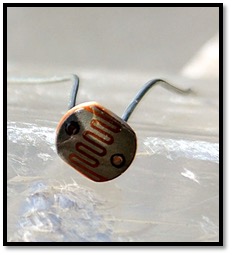
- A Photosensor – There are a couple options here.
- You can use a monolithic photodiode with a single supply transmittance amplifier (OPT101, Texas Instruments). This photodiode is integrated in the same package with an amplifier, and it gives a very linear response between light intensity and voltage signal. The wiring diagram for this device can be found on its datasheet.

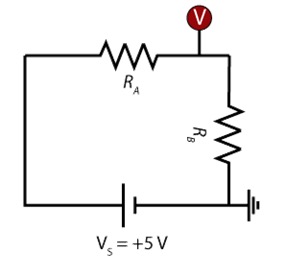
- Alternatively, and for lower cost, a photoresistor could be used (find at Amazon.com). With a photoresister, a static resistor will need to be used that has about the same resistance as the average resistance of the photoresistor (about we use a 4.7 kΩ for the most common photoresistors). A simple voltage divider can be used where the voltage between the two resistors is measured and used to calculate light intensity.
- You can use a monolithic photodiode with a single supply transmittance amplifier (OPT101, Texas Instruments). This photodiode is integrated in the same package with an amplifier, and it gives a very linear response between light intensity and voltage signal. The wiring diagram for this device can be found on its datasheet.


- A Power Supply – We have used both a 9V battery and a 5V source from a data acquisition card; anything from 4 to 12 V should be appropriate.
- A Multimeter – You may not need it if you use a DAQ card, like an arduino board, but you will want it to debug the device, just in case.
- Cuvettes – Standard 1x1x4 cm disposable cuvetts work well (Fisher, 14-955-125). It is also helpful to have the cuvette’s disposable caps (Fisher, 14-385-999). These can also be found now on Amazon.com. However, a variety of containers should work as long as you keep the path length through your sample constant.
- Wire – Standard 22 gauge insulated wire or Cat5 wire will work. Breadboard jumpers are also a good choice.
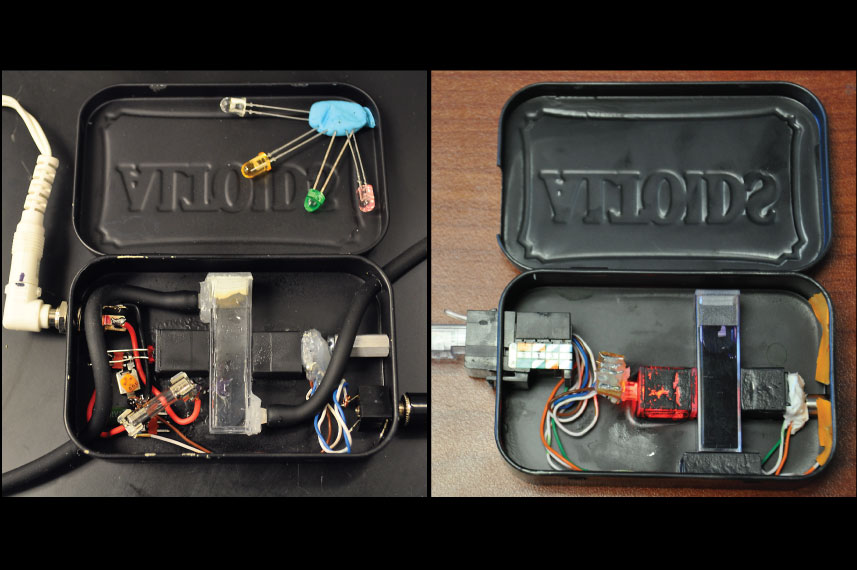
- A Container – An Altoid tin is about the right size; we’ve used everything from pvc parts to 3D-printed and laser-cut bodies. The container just needs to be completely dark inside once the lid is closed.
Items You May Want:
- A Breadboard – You may want to build the circuit and test it on a breadboard first, just to make sure all your components work as you expect.
- A DAQ Card – A data acquisition card that interfaces with a computer will make adjusting the LED brightness and continuously capturing the signal from the photosensor much simpler. The DAQ card we are using is an Arduino Uno. However, you can do everything discussed in this module using a simple multimeter.
- A Computer Interface – We wrote a Python user interface to communicate with the DAQ card. The script is at the end of this module.
Assembling the Spectrophotometer(s):
The assembly of the spectrophotometer is up to the tools on hand and your creativity. The necessary constraints are the following.

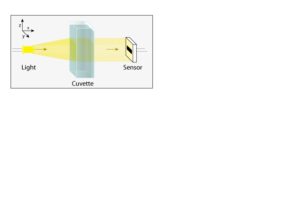
The photometer must have:
- A light source, which will be provided by our LED
- A sample stage, which will be our cuvette filled with liquid of interest.
- A sensor, which will detect the intensity of light (our photoresistor or photodiode)
The light must pass through the sample and into the sensor and it all should be shielded by ambient light in some sort of light-tight container.
We’ve made spectrophotometers out of all sorts of things…

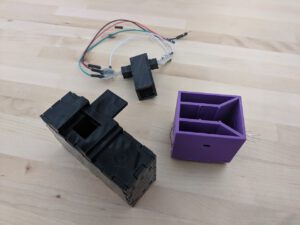
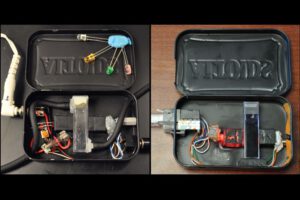
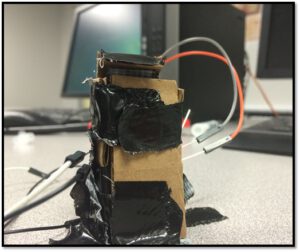

Above are a couple made with laser cutters and 3D printers, but you need nothing more complicated than an altoid tin or any light-tight container and some hot glue. We’ve even had students make working photometers as quickly as possible with duct tape and cardboard (adjacent photo). Of course, the more secure the parts, the better the device.
If using an arduino board the following circuits would be appropriate for taking data from the photoresistor or from the opt101 device.

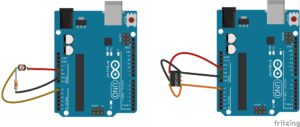
If using a multimeter, you may read the voltage at the point of either of the above illustrations where the wire attached to AI0 (the orange wire). Most blue or green LEDs from RGB LEDs can be powered from the 3.3V off of an arduino board, but a red LED would need an in-series resistor to step down the voltage to avoid burning it out. To select a light with an appropriate wavelength, simply select a light color that is most complementary (“opposite”) to the color of substance you are trying to detect. For example, if you are trying to detect a red molecule, you would want to use a green light (often students want to use a light that is the same color as the molecule they hope to detect, not realizing the molecule is that color because is does not effectively absorb that wavelength).
Materials Needed to Conduct a Simple Kinetic Study:
Some sort of color-changing reaction is needed and many would do:
Reaction of blue food coloring with household bleach:
For a reaction that can be done with materials from a grocery store, we use blue food coloring and household bleach. Blue food coloring seems to be simplest to model as an elementary pseudo-first order reaction (other colors seem to have multiple dye molecules with competing rate constants).
- Blue food coloring. You will want to test it as some of the food colorings don’t work as well; we have had good luck with McCormick brand.
- Household bleach. You will want to check the concentration on the side of the bottle. We prefer the less concentrated 6% bleach over the “concentrated” 9% bleach, just for safety concerns, but they can both be a danger.
Reaction of alkali bleaching of a Triphenylmethane:
Food coloring is not clear on concentrations, and so a more precise method may be desired.The following reaction, with NaOH in excess, has been found to work well as an irreversible pseudo 1st order reaction:
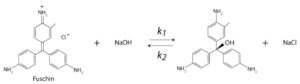

- A Triphenylmethane – Really any reactants that change color will work. We have used malachite green (Acros Organics, 229780250) crystal violet (Fisher, S93213), and basic fuschin. All work fine.
- Sodium Hydroxite – The base will convert the triphenylmethane solutions from colored to clear; really most bases should work.
- Water – The solvent for the reactants.
- A scale – You’ll need to make precise measurements of weight.
Microbial Growth:
- A Microbe – Microalgae, baker’s yeast or a tame e-coli.
- A Reactor and Media – For algae see our photobioreactor module (https://docs.google.com/document/d/1FhHH3iM59KmCBrmBpj-3jCj4bFpTdhB5Q_Qjka3bh8M/). Alternatively see our bioreactor module (https://www.che.utah.edu/community_and_outreach/modules/module.php?p_id=29) for instructions on making a yeast culture.
Background for Teachers
Effective Analytical Equipment
Analytical equipment is a very important, but often an overlooked aspect of science and engineering. Many people see analytical equipment as a black box, which converts experiments into numbers without ever considering how the equipment works. Often, data can be misunderstood due to a poor understanding of how it was obtained. This module has the students build an inexpensive spectrophotometer that allows them to piece together the connections between running experiments, using analytical equipment, and correctly interpreting their results.
There are two primary things we want from our analytical equipment: precision and accuracy. Precision is a measure of the random noise in our measurements. If we repeat our measurement 100 times and each time we get the same numerical measurement then we could say our analytical equipment had high precision, but if the values were dispersed broadly around some average then we might want to try to improve our precision by improving our procedure’s repeatability or eliminating sources of noise (e.g. electrical interference, vibrations, etc.).
However, we can be very precise and very wrong at the same time. An instrument’s accuracy refers to how close the average measurement is to the true value. It may be very difficult to know what the true value is as we only witness the physical world through the lens of many intermediaries, any of which may distort the path between our perception and actuality. To help improve our the accuracy of those intermediaries (such as a spectrophotometer), we will calibrate our equipment with, for example, samples of known composition.
Spectrophotometry
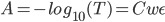
Spectrophotometry uses different wavelengths of light to probe the composition of everything from nano-scale solids to the atmosphere of distant planets. If we know the intensity and wavelength of light entering and exiting a sample, we may infer something about its composition, due to the fact that different atoms and molecule preferentially absorb particular peak wavelengths of light. To make this inference for liquid solutions we typically use the Beer-Lambert Law:
T = I / I0 = 10 – ε l C
where T is the percent of light transmitted, I is the intensity of the light that exits the sample, I0 is the original intensity of the light entering the sample, l is the path distance of the light through the sample, C is the concentration of the compound absorbing light within the sample, and ε is a constant for that absorbing compound at that particular wavelength of light (its extinction coefficient).
Equation 1 may be linearized by taking the log of both sides:
log( T ) = – ε l C
For our spectrophotometer we receive an output voltage that is linearly proportional to the light intensity exiting the sample. We can plot the log of the voltage verses known concentrations with a known sample width, l, to get ε from the slope of the line:
log( V ) = – ε l C + log( V0 )
where V is the measured voltage and V0 is the voltage from the photosensor measured with C = 0 (Most often pure water in a cuvette).
Microbe Growth
See our modules on photobioreactors and bioreactors for theory and background on microbe growth.
- https://docs.google.com/document/d/1FhHH3iM59KmCBrmBpj-3jCj4bFpTdhB5Q_Qjka3bh8M/
- module.php?p_id=29.
Reaction Kinetics
The reactions used to test our spectrophotometers are typically alkali bleaching reactions of a Triphenylmethane, like fuchsin or malachite green. These reactions have the following rate equation:
R = k [Dye]α [NaOH]β
For Triphenylmethane dyes the reaction orders, α and β, are both 1. Students may be asked to demonstrate these orders by keeping NaOH in excess (see our procedure) and altering dye concentration. If α is 1 then the natural log of dye concentration should be linear with the slope being the pseudo first order rate constant, k’, which is equal to the reaction’s rate constant, k, times the concentration of NaOH raised to the power of β. A similar method may be used to determine β while holding [dye] constant and altering [NaOH]. If we double the concentration of NaOH and the pseudo rate constant doubles, then β is 1; if it quadruples then β is 2, and so on. If we can keep [NaOH] in excess by a couple orders of magnitude, we can safely assume its concentration doesn’t significantly change over time, [NaOH]0. With such an assumption we find:
![]()
Where C is the dye concentration. Solving this ODE we find:
![]()
![]()
ln (C / C0) = k [NaOH]0 t
If we plot the natural log of the dye concentration divided by its initial concentration versus time, we should obtain a straight line with a slope of m. The rate constant k should be that slope divided by the concentration of base raised to the β power, which should just be 1.
Intended Learning Outcomes
- Students will understand how scientist and engineers use light to obtain important physical measurements.
- Students will learn how to relate transmitted light to concentration.
- Students will see under the hood of analytical equipment and get a feel for what can go wrong in our measurements.
- Students will learn the importance of calibration to measurement accuracy.
Instructional Procedures
Calibration:
At the very least, to determine kinetic parameters, the student first needs to know the voltage of their sensor readings when no light goes through the sample, Vblack, and when no light is attenuated by the sample, Vclear. Because some light may travel around the sample, just turning off the light isn’t best, and so a black cuvette is needed (we simply fill a cuvette with black paint). For Vclear a cuvette filled with clear water is used (an empty cuvette is not sufficient if you’re tracking a reaction in liquid water).

Example clear and black calibration cuvettes.

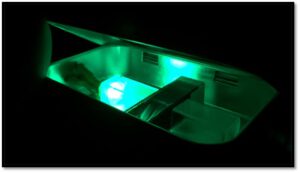
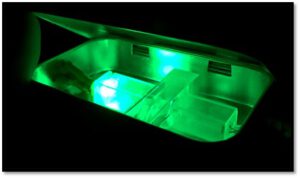

A photometer with a black and a clear calibration cuvette.
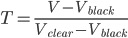
Create black and clear cuvettes and have students take reading with both in their spectrophotometer. As a first approximation the transmittance, T, through the sample can be calculated as:
![]()
Where V is whatever voltage is read with the sample in the spectrophotometer. This equation does not take into account the nonlinearity of the response of either type of sensor but we have found it to be more than sufficient to obtain reasonable data and kinetic constants.
If time is short, Vblack may be taken to be the voltage with the LED unplugged, and Vclear may be taken to be the voltage at the end of a bleaching reaction.
Performing a Simple Bleaching of Blue Food Coloring:
- Add a variable known concentration of household bleach to a cuvette (no more than 50 drops, assuming 50 μl per drop).
- Fill the remaining volume with water to about 3.5 ml
- Add one or two drops of blue food coloring.
- Cap the cuvette firmly and shake to mix.
- Place in spectrophotometer.
- Collect voltages as a function of time.
- The reaction should proceed for about 5 minutes until it becomes clear.
- This reaction has sodium hypochlorite in excess and can be modeled as a first order reaction as discussed in the technical background section of this module.
Performing Alkali Bleaching Reaction of a Triphenylmethane:
We will assume you are using fuchsin but the following procedure would work for many other reactions.
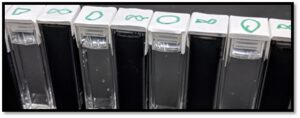
- Create solutions of water and varying concentrations of fuchsin to be used for calibration of your spectrophotometer. The concentrations should range across the concentrations expected in your test reactions.

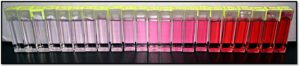
Calibration standards, ranging from 0 to 1e-4 M fuchsin
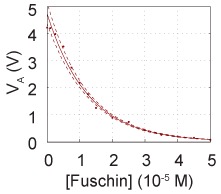
- Next, put each calibration sample into the spectrophotometer and measure the voltage for each. You should end up with a calibration curve that looks something like that in the figure below.

- Calculate the transmittance for each voltage at each known calibration concentration. As stated above the transmittance can be assumed to be approximately linear with respect to voltage.
- Calculate Absorbance for each concentration. The data should follow the Beer-Lambert Law:
Where A is absorbance, C is concentration, w is width of the cuvette, and ε is the molar extinction coefficient.

- Fit a line to the plot of absorbance versus known concentration and the slope should be the molar extinction coefficient; the intercept should be zero (zero concentration should mean zero absorbance if you got your Vclear and Vblack right). The width of a cuvette is known (or measurable) at 1 cm, typically. This fit may be done in a program like Excel or most coding languages.
- Now prepare two solutions. One of known concentration of fuchsin and another of known concentration of NaOH. The reaction rate of fuchsin with NaOH follows R = k [fuchsin] [NaOH], and if we use an excess of NaOH we will have a pseudo first order reaction. We used fuchsin concentrations between 1e-5 and 1e-4 M for Solution 1 and 0.05 M NaOH for Solution 2.
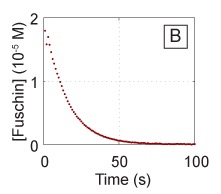
- Mix Solution 1 with Solution 2 in a cuvette and quickly place it in the spectrophotometer (note that, by mixing the two solutions, you have now changed the initial concentrations of your reactants and you will need to account for the change in volume for both). Measure the voltage over time, and you should see something like the data in adjacent figure, after converting to concentration from the voltage signal using the curve obtained in the previous steps.
- Repeat the previous two steps with the same concentrations multiple times if you wish to quantify the precision of your spectrophotometer.
- Repeat your kinetic measurements with various concentrations of fuchsin to determine the reaction order with respect to fuchsin, which should be one.
- After the kinetic constant is determined with excess NaOH, the NaOH concentration may be varied to get the reaction order with respect to NaOH, which should also be one.
- To obtain the rate constant you will need to take the log of the concentration to linearize the data again. The following figure shows multiple linearized runs for repeated experiments, using both our homemade spectrophotometer (red) and a commercial option (blue).

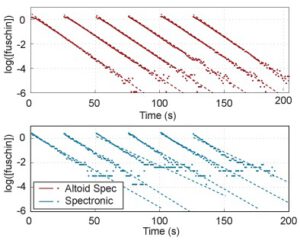
Aside,from the data above of multiple trials of the same reaction, it is apparent that the student can build a photometer that is more repeatable and sensitive at low concentrations than those purchased for thousands of dollars (though, it is limited to the wavelengths of the LEDs used).
Monitoring Cellular Growth:
- You may perform a calibration for yeast or another microbe in a manner similar to that described for fuchsin in the previous section. However, instead of pure water, you may want to use your starting solution of media and yeast to adjust the LED voltage. Note that scattering of light plays a significant role in spectroscopy in bioreactor, and so your calibration curve may not exactly fit Beer-Lambert Law. Keep in mind that microbes will settle out of solution over time and you will want to shake your calibration solutions up before you take a measurement.
- Make a simple bioreactor. You can make a photobioreactor following our photobioreactor module (https://www.che.utah.edu/community_and_outreach/modules/module.php?p_id=19). Alternatively you may make a simple bioreactor to grow yeast (https://www.che.utah.edu/community_and_outreach/modules/module.php?p_id=29). In a stirred beaker, mix 40 g/L glucose (Fluka, 50409047), 10 g/L yeast extract (Sigma, Y1126-250G), 20 g/L of bacto peptone (Sigma, P0556-250G) and 2 g/L yeast (from the grocery store).
- You can take periodic measurements or use a small pump to pump the solution from the bioreactor into the flow cell of your spectrophotometer and then back. If you take periodic samples remember to shake them up before you put them in the spectrophotometer.
- Monitor the voltage for at least 6 hrs.
- If you wish to observe the stationary and death phases, you may need to take data over several days.
- As the yeast grow they will absorb and scatter more and more light. Different phases of cellular growth should be apparent in the rate at which the absorption changes.
Optional Activities & Extensions
- Conduct kinetic studies at different temperatures to determine Arrhenius constants.
- Monitor biological growth at different temperatures, pH, or with different media or contaminants to determine monod constants.