Lego Air Quality Sensor
Summary
Poor air quality is a problem that affects the health of many communities, and measuring air quality can be extraordinarily important to people with health problems. In this module you will build a simple air quality sensor with some standard electronic components and building blocks (e.g. legos).
General Information
Essential Questions
- What is air pollution made of?
- What is PM 2.5?
- How can we measure air quality?
- What is scattered light?
- What is important when building a sensor?
- What is drift? Systematic and random noise?
Materials & Methods
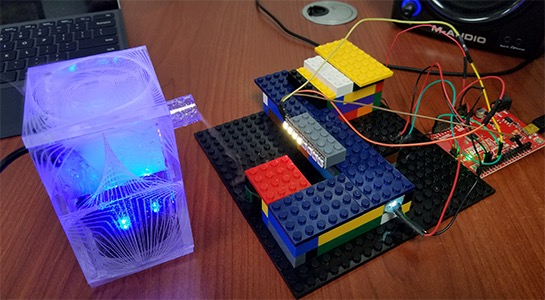
- Assorted legos or similar building blocks to construct the sensor’s light and air path. See the picture above for some idea of the numbers of blocks needed.
 Assorted blocks.
- Example: https://www.amazon.com/dp/B015EQILH8
- One of these 1000 piece sets can build about 4 or 5 sensors.
- Flat boards for foundation and/or roof of sensor.
- Example: https://amzn.com/B01DFOMNAC
- Example: https://www.amazon.com/dp/B015EQILH8
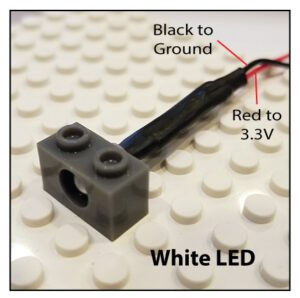
- One lego block with an attached LED light.
- LED example: IL051 5mm Clear White LED https://www.amazon.com/gp/product/B004JO2HTA/ref=oh_aui_search_detailpage?ie=UTF8&psc=1
- You can drill a hole for the LED or buy bricks with holes already in them (http://a.co/dP2R9pb).
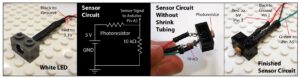
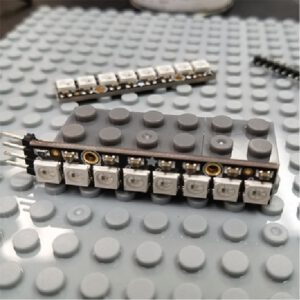
- One lego block with an attached photoresistor and voltage dividing static resistor to act as the sensing element of our air quality sensor. The photoresistor type for the 10 KΩ static resistor should be GL5516, but several models may work with a different static resistor inline.
- For example (http://a.co/1DZxhZy).
- Pictured below.
- Female to male wire jumpers to connect components to the Arduino.
-
- For example: https://amzn.com/B00AC4NQYG
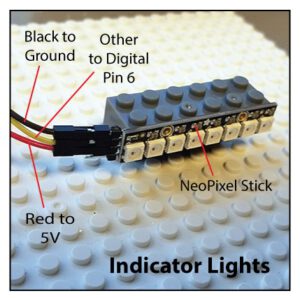
- One LED light indicator to display a relative measure of air quality. Alternatively, a multimeter could be used to read the resistance on the photoresistor and avoid using Arduino boards altogether.
-
- We are using an arduino board with NeoPixel lights (https://www.adafruit.com/products/1426). You will need to use these to items to use our code for the arduino board. You will also need to solder some pin headers to the neopixel stick in order to connect the lights with the jumpers (https://amzn.com/B00R1LEIL8).


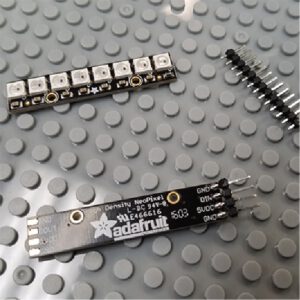
- We are using an arduino board with NeoPixel lights (https://www.adafruit.com/products/1426). You will need to use these to items to use our code for the arduino board. You will also need to solder some pin headers to the neopixel stick in order to connect the lights with the jumpers (https://amzn.com/B00R1LEIL8).
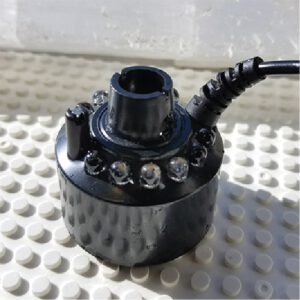
- Fog machine or mist generator to simulate air containing particulate matter.
- For example, ultrasonic mist generator (Shown in the image below, on the left): https://amzn.com/B00GSKCW70
- For example, fog machine: https://amzn.com/B00F2ATEDC
- You may also trigger these sensors with the smoke from a blown-out match, but you may want to avoid polluting the air without significant ventilation. Also, use caution with a candle or match because they could trigger a sprinkler system.
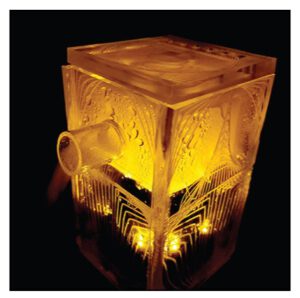
- We cut a case for our mist generator (image below on the right), but you can just place it in a simple cup; though, you will want to partially cover the top to keep splashing to a minimum,

- Fan used to pull air through the lego sensor. You can either connect this to lego pieces or slip it in between pieces.

- Arduino Uno board or equivalent. Alternatively, a multimeter could be used to read the resistance on the photoresistor and a 5V power supply could power the device.
- For example: https://www.sparkfun.com/products/12757 . Note that we are using the SparkFun RedBoard but a traditional blue arduino works just as well.
- The board can be powered through a USB cord to a phone charger or computer, or through a 5 V power supply.
- An arduino with connections labeled is pictured below.
- Some basic understanding of Arduinos is required. The board must contain the Neopixel code (see: https://github.com/adafruit/Adafruit_NeoPixel, and https://learn.adafruit.com/adafruit-neopixel-uberguide/arduino-library-installation) and the following arduino script:
Background for Teachers
To present the background you may use the accompanying slide show:
https://docs.google.com/presentation/d/1sc_QHbBamYe9fkiuvdFguANOjlmAPU9huqi7g6odd8M/edit?usp=sharing
Air Quality Background:
The World Health Organization estimates that in 2012 approximately 3.7 million people died as a result of ambient air pollution. Among commonly monitored air pollutants, fine particulate matter (PM2.5), particles with diameters smaller than 2.5 microns, has the greatest adverse health effects. Elevated PM2.5 levels are a particularly important issue in northern Utah where PM2.5 levels can exceed national ambient air quality standards for periods ranging from a few days to weeks, particularly in the winter. These episodes of poor air quality create significant health and quality-of-life consequences for the region’s citizens, including increased incidence of asthma, juvenile arthritis, and mortality.
Government agencies, such as the Utah Division of Air Quality (DAQ), and citizens rely on air-quality data from sparsely distributed monitoring stations for planning purposes and for communicating air quality. These stations are equipped with high-quality, costly instruments that meet federal monitoring requirements. However, sparsely distributed stations may not accurately represent the pollutant gradients within a city. In Salt Lake City differences in elevation, land use and other factors result in daily average PM2.5 concentrations at the neighborhood-level that may not be well represented by the nearest state monitoring station. In addition to sparse spatial distribution, the government monitoring stations have limited temporal resolution. For example, only two stations in Salt Lake County provide hourly PM2.5 levels. This gap in temporal resolution is particularly important in light of studies suggesting that even short-term increases in pollutant levels increase the incidence and severity of asthma and cardiac events.
Networks of low-cost, air-quality sensors can help bridge these spatial and temporal gaps and provide key information to air-quality managers, health-care providers, and the community at large to better understand air quality and minimize exposure risks. However, many of these low-cost sensors lack independently gathered calibration data, quality assurance procedures, or descriptions of when the sensors may provide inaccurate readings. Presenting unreliable or uncertain information from sensor networks can cause either unnecessary public concern or complacency about pollution levels and the associated health risks.
Two of the project goals are to leave each classroom with a low-cost, air-quality sensor and to have your class help determine:
- How well outdoor air-quality measurements represent local air quality in and outside your school.
- How well the sensors perform over time.
Electronics Background:
Only very basic understanding of electronics is useful but not absolutely necessary.
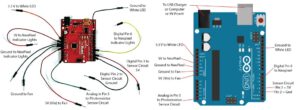
Arduino Board: All the needed connections on the arduino board are highlighted in the figure in the Materials section of this module.
White LED: The LED light connects to 3.3 V to produce a white light in the sensor’s light source. Note that LEDs are directional; most of the time the shorter wire on the LED should go to ground and the longer wire to the higher voltage, but not necessarily. If the LED does not turn on you may try switching the ground to the other wire. The LED can easily fit in lego blocks meant to hold axles, or a solid block can be drilled to fit the two wire leads and the light can be glued to the surface.
Fan: The fan should have a red and black wire. The black wire should attach to ground and the red to 5V supply (Use Vin when powered by a USB cord). Have the students wire up the fan and take note of which direction it blows air so that they install it correctly. It is likely better to pull air through the sensor than to blow air into it; the air will move more smoothly through the sensor. Care should be taken to keep fingers away from the spinning fan.
Photoresistor Sensor: A photoresistor is a component that resists the flow of electrical current dependent upon how much light is shining on it. Because the Arduino boards can only measure voltage, we must use the photoresistor in a simple voltage divider circuit and measure the voltage between the photoresistor and another resistor. We want the voltage signal to increase when more light hits the photoresistor and the photoresistor we are using decreases resistance with more light. As such, our voltage divider should have the photoresistor nearest to the 5V power supply and a standard static resistor nearest to ground. See the circuit diagram for the sensing circuit in the Materials section.
During our experiments our brand of photoresistor ranged from 5,760 to 4,183 ᘯ, from clear air to air filled with mist. To assure we have sufficient voltage response we chose a static resistor of 10 kᘯ. We pre-solder and secure this voltage divider to a lego block prior to starting this teaching module, but a more in-depth procedure could have the students create their own sensing circuit.
Note that the black wire from the sensing circuit should go to Pin 2 on the arduino (which the code sets to ground, 0V)). The red wire should go to Pin 3, which the code sets to 5V. For our arduino code to respond properly, the third wire should go to the analog in pin, A5.
Indicator Light: The NeoPixel light strip we are using (https://www.adafruit.com/products/1426) has eight lights but it is very simple to use and hook up. The black wire should go to the arduino ground, and the red to the arduino 5V. The third wire must be plugged into the digital pin number 6 in order for the script to properly operate the lights. Once connected and calibrated (as described in the methods section) the lights should go from green to red and increase in number as they detect more particulates in the air.
Light Scattering Background:
The sensors built by the students (and many research sensors) work by measuring scattered light. As light travels through clean air, which is free of particulate pollution, it travels roughly in a straight path. Almost none of the light could make, say, a 90° turn. However, if particulate matter filled the air, light may be reflected off the particles in a random direction. You can readily see such scattered light if, for example, you shine a laser through a cloud of smoke; the result will appear as a line of scattered light traveling through the cloud, whereas with clean air you may not ever detect a laser was passing through the space (Such a demonstration with a laser pointer and fog machine can be a good introductory addition to this module; you could also use a blue laser and tonic water compared to regular water as the tonic water’s quinine will scatter the laser light).
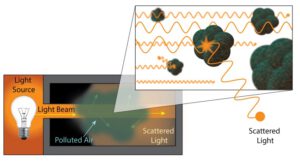
While this light is scattered randomly, some of the light will be scattered towards our sensor and detected. The more particulate matter in the air, the more likely it is that a photon of light will find its way to the sensor (a photoresistor in the instance of this module), and therefore we can quantify the amount of particulate pollution in the air.
Alternatively one could attempt to detect the amount of light lost after passing through the polluted air, by placing the sensor directly across from the light source. In this case more light would hit the sensor in clean air than in polluted air. If students attempt this method they are not likely to be successful due to the fact that the sensor will likely be saturated with light and insensitive to the loss of a very small percentage of its total intensity. Scattered light is a prefered indicator of particulate matter because 1. such sensors are typically more sensitive to the range of light intensity between zero and minimal light than between two large intensities of light; and 2. scattered light can be more indicative of particle size.
As such, we would suggest a possible working design for such a sensor may look like the following illustration (though we would recommend you do not share this with students; results are more memorable if they are allowed to explore their design options and then explain their performance):

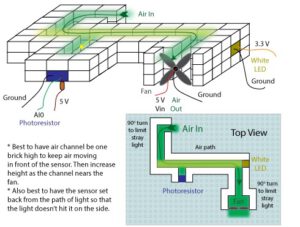
The sensor is 90° off from the light path, and somewhat setback and a fair distance from the light to avoid direct light hitting the sensor. The air path makes several turns to avoid light pollution from the outside. However, several designs may be successful and students should be encouraged to exercise their creativity.
Instructional Procedures
- Group students into teams of, preferably, 3 (greater than 4 would not be advised).
- Give the background information on air quality and how the sensors are meant to work.
- This slide show may be useful: https://docs.google.com/presentation/d/1sc_QHbBamYe9fkiuvdFguANOjlmAPU9huqi7g6odd8M/edit?usp=sharing
- Pass out assorted lego pieces, along with the white LED light, photoresistor circuit, fan, and indicator lights.
- Have student plan and maybe sketch out their sensor designs, and discuss their design decisions. You might ask them to consider:
- Where the detector should be placed relative to the white LED? Should it be in the path of the light or at some angle? We want scattered light and so the sensor should be at a 90 degree angle off of the light path, and set back a bit so that the light isn’t constantly hitting the side of the sensor.
- How can we get the greatest range of response from the sensor? Make sure it’s as dark as possible when there are no particulates in the air. This would mean they need to shield the sensor from outside light, which may necessitate a couple layers of legos over the sensor.
- Why would we want to maximize the range? The greater the range the more sensitive their sensor will be to small changes in air quality.
- How long should the light and air paths be designed? How high should they be? What do we want to maximize and minimize? Is turbulent or laminar (non-turbulent) flow important? The air will tend to flow in smooth streamlines with relatively little turbulence and so it is best to have a channel that is one brick high in front of the sensor (otherwise the stream carrying the particulates can go above the sensor’s detection). The path lengths should be sufficient to keep stray light out and keep the LED from shining on the sensor directly.
- How can you minimize noise from stray light? They must shield the sensor with dark legos and keep the light intensity from changing due to shadows and switching on or off room lights.
- How do the colors of the blocks or the thicknesses matter? Do they? Dark blocks are better from keeping out stray light.
- Give 20 min for teams to create their own lego sensor.
- As student teams finish, instruct them on how to wire their components to the arduino board. The diagrams in this module (specifically in the materials section, and the one-page handout at the end of the module) should be useful in clarifying wire connections. The wiring could be simplified and made a bit clearer by using a breadboard, but we have designed this module such that it will run only using an Arduino Uno’s native connections.
- The white LED should be connected to ground and the 3.3V source. Connecting to the 5V source could burn out the LED.
- The black wire of the fan should be connected to ground, and the red wire to the 5V source (Use Vin on the board; it is at 5V, when powered through the USB port). If you power the arduino with, say, a 9V power supply, Vin will be 9V and may burn out the fan.
- The black wire on the sensor circuit should connect to Digital Pin 2 and the red wire should connect to Digital Pin 3. In the Arduino code, Pin 2 will be set to 0 V (‘LOW’) and Pin 3 will be set to 5V (‘HIGH’). We are using the digital pins because we need more grounds and 5V than the board has, and the sensor requires very little current. If using a breadboard, they could be powered with the standard 5V and ground. To read the voltage from between the resistors in the photoresistor sensor, the third wire (which will be some color other than red or black) should be connected to the Analog-In Pin 5 on the Arduino.
- The red wire on the Neopixel Stick should connect to 5V and the black to ground. The third wire should connect to Digital Pin 6. The Arduino code uses this pin to alter the light intensities.
- Make sure clear clean air is flowing through their sensor for the first four seconds; during that time the code will find the minimal signal. The lights will turn blue when first powered on and while it calibrates; once it is done calibrating the blue lights will turn off. The sensor will then appear noisy. Blinking from green to red due to the fact that it self calibrates. As it detects more and more ‘pollution’ it moves it’s maximum reading up. As such, each sensor has to experience high ‘pollution’ before it can display properly. Flow fog or the mist from the mist generator into the sensor to set a proper maximum.
- Once it has calibrated, the sensor should respond properly to mist and any other sort of particulates flowing into it.
- Go around the room and calibrate and test each sensor with the mist generator or fog machine as they are finished. Pay special attention to:
- Sensor susceptibility to ambient light noise (which may introduce systematic or random noise). Some sensors can be made to change their reading by shading them with your hand, or bringing them into light (a phone’s flashlight near the sensor block can be used as a good test of sensor robustness to ambient light conditions). If a student’s sensor reacts to an outside light source, then they should better shield the sensor.
- Sensor drift (systematic noise). Over time, the sensors’ minimum reading may change, although the device remains in the same conditions. This presents a good opportunity to talk about the problem of sensor drift. Drift may happen for many reasons: the sensor may get dirty, the power sent to the light may change slightly, and so on. Furthermore, you may find drift is very significant upon a cold start of the sensor; the first time you turn it on, it may calibrate poorly. To reset the sensor, either unplug and plug the sensor back in, or, preferably, press the reset button on the corner of the Arduino board, just next to its USB port. When you reset the board, be sure to allow at least 4 seconds of clean air to flow into it or you may corrupt the calibration.
- Sensor noise (random noise). When you flow a constant stream of mist or fog into the sensor you will likely not see a constant signal. It will peak and fall frequently. This random noise may be due to several factors and should be a question for the students to consider. Firstly, the flowing air can be turbulent through their sensor and ‘pollution’ passes by in turbulent eddies, which may have different concentrations of particulates, altering the the amount of light scattered. Alternatively, the smoke or mist may travel in thin streams if the flow is laminar, which may, at times, move above the sensor’s optimal viewing area and then dip back down into it. If the air chamber is too high this may be a significant problem. Also, electronic noise may be a problem if the sensor is placed too near to another electrical device, like a cell phone, or perhaps even the motor on the fan.
- Note the Arduino code has a low-pass filter built into it; it is controlled by a variable named alpha. You may wish to alter this value to show students the tradeoff between low noise and fast sensor response. The higher the value of alpha, the less noise in the reading but slower the sensor will respond to changes in air quality.
- Have the teams explain their designs and its performance to the class. Discuss means to improve their sensors and the design factors that seem to be the most important to sensor performance.
- If your students are hosting an AirU sensor, discuss how their sensor is very similar in its functionality to the professional sensor used in the AirU research program and the same problems can affect this sensor.
- You may wish to other design constraints. Sensors can be weighed to find the working sensor that uses the least amount of materials. External light sources can be used to find the sensor least sensitive to noise, and so on
- If time allows, students could attempt to improve their sensors and test them again.
Source Code
Arduino
Acknowledgements
These teaching modules are supported by the National Science Foundation and the Rocky Mountain Power Foundation.